Announcements -> Study Guide Questions for the final
The final exam will contain 15-20 questions identical to or very similar to the following. Some of these questions will be explicitly done using Excel.
- Explain what an expectation value is and how that forms the basis for estimating statistical probabilities.
- What is the overall value of using statistics in building and testing a model against some data set?
- I wish to give 15% of my class and A on a midterm exam but I also want those students to get more than 87% on the midterm exam. My exam has an average score of 79%. What must the standard deviation on my exam be in order to meet my goals?
- Review the explicit calculation of &chi2; conceptually understand expected frequencies
- Know how to use the regression tool in Excel!
- Know how to set up a &chi2 analysis in excel.
- Know how to use excel to do &sigma clipping
- The Zinderland News (ZNN) has just released a story where Zindertists (a.k.a. Zinderland scientists) have reprogrammed the ZNA of Zinderbites so that Zindernoodles can grow faster. Since everyone in Zinderland understands regression. The ZNN story
merely said:
Growth = (2.0 +/- 0.5) * Zbites + 2; &sigma =0.7 Using Zbite = 10, calculate the 95% confidence levels on Growth
- Explain how the central limit theorem helps show the statistical power of independent and random sampling of some parent population.
- Describe some techniques you can employ when you are working with noisy data
- If each step I take is 2 feet and I take 1600 steps, each one in a random direction, on average, how far have I moved from my point of origin?
- Stephanie, an expert sailor, is able to sail a
specific course with an average time of 16 +/- 1 minute based on N=16 trials. Evan, a complete novice, sailed the same specific course, but due to sea sickness problems, was only able to complete N=4 trials. His average time was 20 +/- 4 minutes. Is Stephanie a significantly better sailor than Evan?
- Explain how the Dmax statistic is derived in the KS test and why the KS test is such a powerful statistical test when comparing one distribution with another.
- On average, 4 dead Zardhogs appear every 2 miles of Texas highway. What is the probability that a Zardhog cleaning crew will have to process 6 dead Zardhogs in 1 mile of Texas Highway?
- What assumptions need to be made to treat observed data as a Poission distribution?
- Physically explain how the presence of a planetary atmosphere leads to a "greenhouse" effect.
- Why does water vapour act as the primary greenhouse gas on the Earth?
- Explain why, in the longer run (e.g. greater than 100 years) methane is likely to be the dominant greenhouse gas in the Earth's atmosphere
- What is the principle difference between logistic growth and pure exponential growth.
- Explain why the Lotka-Volterra model predicts a density dependent lag time between predator and prey abundance. Which reaches (predator or prey) their peak density first and why?
- Explain how the concept of predator "handling time" acts as a feedback that can control prey density.
- Explain some of the difficulties associated with producing an accurate estimation of the projected US population in the year 2050.
- Explain why the assumption of a continually declining exponential growth model for the world's population may be unrealistic. Provide a conceptual example of what a more realistic model might be.
- Review Estimation techniques and its components
- Explain why the adult survival probability is the critical parameter that determines &lambda (the growth rate of mammalian populations
- Explain why finite age effects (the W parameter) have such a strong effect on the crash rate (e.g. negative growth rate) of mammalian populations
- Explain why an estimate of the demographic potential of a species, k, provides an important indicator of how habitat loss can be used to determine the decline in species population
- In calculating the effects of habitat loss on a species, three critical variables are used: p, h and k. Explain what each of these are and which of these there is the most important to accurately measure.
- Explain how probabilities can still be assigned to events in the case of a skewed statistical distribution in which the median is numerically less than the average value.
- For physical events that occur in nature (e.g. floods, wind speeds, etc) explain why a skewed distribution is a better fit to such data than a normal distribution.
- In a Weibull distribution, what does the shape parameter control?
- For a time series analysis that shows periodic fluctuations, what basic function is used to describe those fluctuations and what are the parameters of that function?
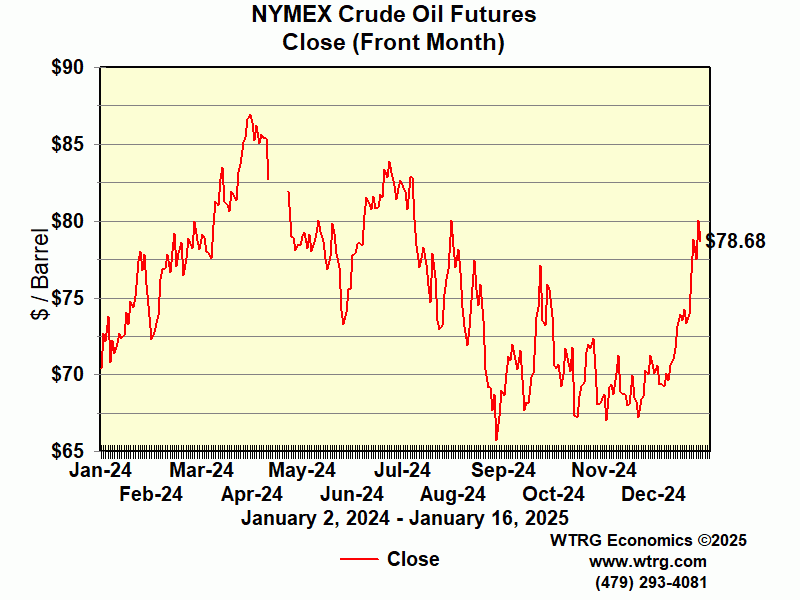
- Below is the time series showing the current price
of crude oil.

a) Provide a qualitative description of this waveform
b) Your boss orders you to predict the value in the year 2010 - describe your procedure for doing this
- Explain why the detection of climate change is intrinsically difficult.
- Explain why we know that the El Nino/La Nina cycle can't be the major driver of the observed regional climate changes, over time, in the Pacific Northwest.
- Explain why you should always, always, always plot your data.